
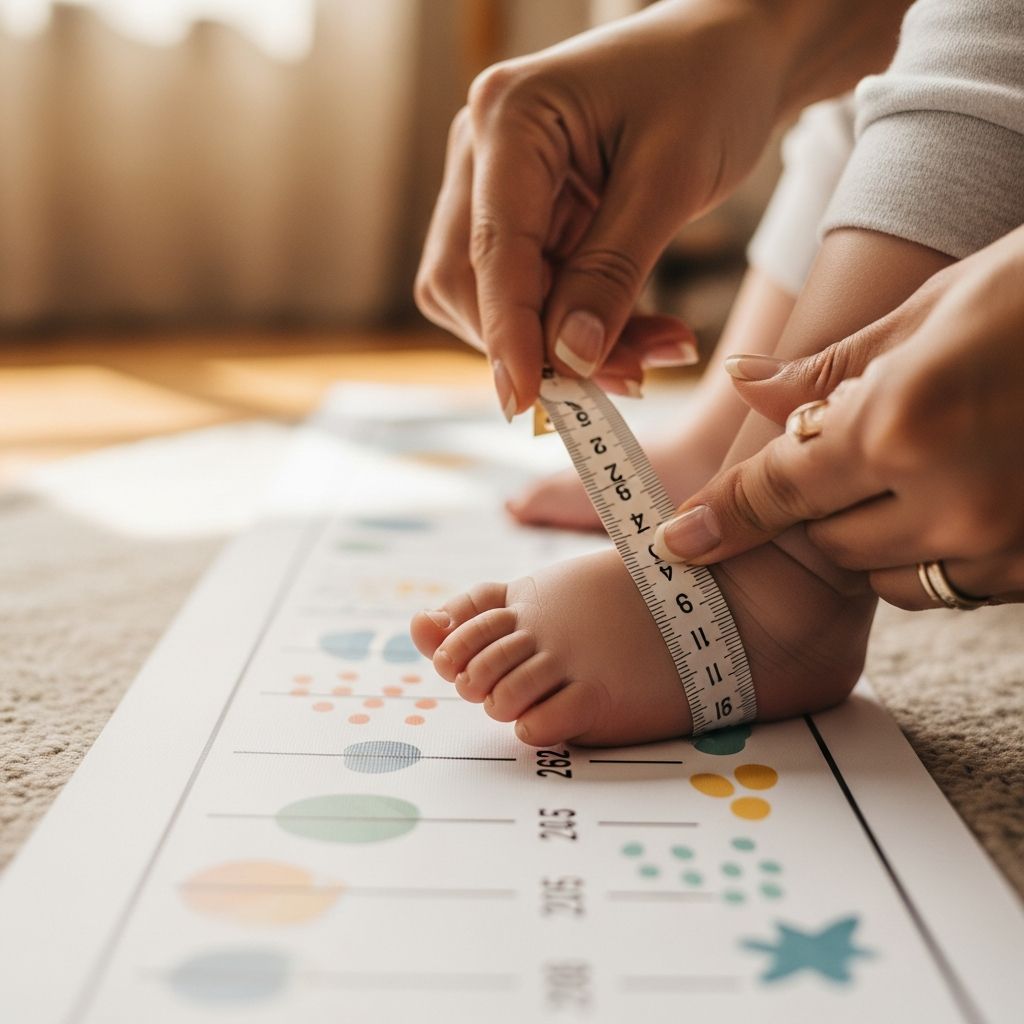
When a child visits the doctor, height, weight, and other measurements do more than fill a chart — they help paint a picture of overall health and development. Growth charts are one of the simplest tools used to follow this picture over time, but they often cause confusion or worry for parents.
This article explains what growth charts are, what percentiles actually mean, how doctors use them, and how you can support healthy growth at home in a calm, informed way.
What Is a Growth Chart?
A growth chart is a visual tool that compares a child’s measurements to reference data from large groups of children of the same age and sex. It shows how a child is growing over time rather than judging health based on a single number.
These charts are typically created using population studies of thousands of children and are updated periodically to reflect current data and health standards. They provide a standard frame of reference so that a pediatrician in one location can interpret growth patterns similarly to a colleague elsewhere.
Key Measurements on a Growth Chart
- Length or height: Length is measured for babies lying down; height is measured standing for older children.
- Weight: Tracked from birth onward and often evaluated together with length or height.
- Head circumference: Measured in infants and toddlers to monitor brain and skull growth.
- Body Mass Index (BMI): Calculated for older children and teens to estimate whether weight is in a healthy range for height.
Different charts may be used depending on the child’s age and sometimes medical history. For example, some charts are designed specifically for premature babies or children with certain health conditions.
Percentiles: What the Numbers Really Mean
Percentiles are at the heart of growth chart interpretation, but they are easy to misunderstand. A percentile does not grade a child as “better” or “worse” than others; it simply shows where the child falls in a range of normal sizes.
For example, if a child’s weight is at the 30th percentile, it means that compared with the reference population, about 30% of children weigh less and about 70% weigh more. This still lies within the broad range of typical growth.
Common Myths About Percentiles
- Myth: Higher is always better. A child in the 90th percentile for weight is not automatically healthier than one in the 25th percentile. What matters is whether the number matches the child’s body type, family patterns, and overall health.
- Myth: Percentiles must stay the same forever. Mild shifts up or down are common as children go through growth spurts, illnesses, appetite changes, or changes in activity.
- Myth: One low or high point is an emergency. Doctors look for patterns over time, not a single dot on the chart.
How Doctors Use Growth Charts Over Time
At each visit, the doctor plots new measurements on the chart and reviews how the child’s growth pattern compares to earlier points. The goal is not to hit a specific percentile, but to see whether growth follows a steady and reasonable path.
Growth charts also work alongside other information: family height patterns, birth history, nutrition, chronic illnesses, puberty timing, and developmental milestones. Together, these help the provider decide whether growth looks healthy or whether more evaluation might be helpful.
Patterns Doctors Watch For
- Consistent tracking: The child follows roughly the same curve without sudden jumps or drops.
- Gradual shifts: Slight movements between nearby percentiles that make sense given nutrition, activity, or puberty.
- Sudden changes: A sharp rise or fall that crosses several percentile lines, especially if it happens quickly or affects more than one measurement.
- Mismatched measures: For example, weight and height percentiles that are very far apart, or a sudden stop in head growth in an infant.
Reading a Sample Growth Chart
The table below shows an imaginary example of how height percentiles might look over several years for the same child. This is not a diagnostic tool, but a way to understand how patterns matter more than single numbers.
| Age | Height | Approximate Percentile | What a Doctor Might Think |
|---|---|---|---|
| 12 months | 75 cm | 40th | Within typical range; note baseline curve. |
| 24 months | 86 cm | 45th | Tracking close to earlier percentile; pattern is steady. |
| 3 years | 94 cm | 35th | Slight shift down but still close; continue to monitor. |
| 4 years | 99 cm | 20th | Several percentile lines crossed; consider history, exam, and possibly further evaluation. |
In this example, no conclusion is made from one visit alone. Instead, the downward drift over time, especially if paired with other concerns, might prompt more questions or tests.
Different Charts for Different Situations
Not all children are measured using the same chart. Infants and toddlers usually have charts focused on length, weight, and head circumference, while older children and teens have charts that place more emphasis on height, weight, and BMI.
Some children benefit from specialized charts. These may include premature babies, who need their age adjusted for early birth when interpreting growth, or children with specific syndromes, where tailored reference data provides a more accurate comparison.
Why the Type of Chart Matters
- Age-appropriate expectations: A newborn and a teenager have very different growth patterns and need measurements compared with the correct age group.
- Medical relevance: Specialized charts account for common patterns seen in certain health conditions, helping doctors avoid mislabeling normal differences as problems.
- Consistency: Using the same type of chart over time helps reveal long-term patterns more clearly.
When a Change May Signal a Problem
Most variations in growth are normal and reflect genetics, appetite, activity, and timing of growth spurts. However, some trends suggest that a closer look is needed. These trends usually matter most when they are repeated, marked, or combined with other symptoms.
Doctors consider a child’s entire picture: energy level, school performance, illnesses, diet, sleep, family heights, and more. A concern on the chart often leads to more questions, not instant conclusions.
Growth Patterns That Deserve Attention
- A child who suddenly stops gaining weight or height for several visits in a row.
- Measurements that fall far below or above the expected range for age and family background.
- Head circumference that grows too slowly or too quickly in an infant.
- A rapid rise in weight percentile without a similar change in height, especially if paired with low activity or other health issues.
If your child’s doctor notices one of these patterns, they may suggest a follow-up visit, lifestyle changes, or medical tests to understand what is happening.
Supporting Healthy Growth at Home
While growth charts help track development, everyday habits at home play a major role in how children grow. Parents cannot control every factor, especially genetics, but they can shape a healthy environment that allows a child to reach their own potential.
Focusing on routines and behaviors rather than the numbers on the chart helps protect both physical and emotional well-being.
Practical Ways to Promote Healthy Growth
- Offer balanced meals and snacks: Include a variety of fruits, vegetables, whole grains, proteins, and healthy fats across the week rather than chasing perfection at every meal.
- Encourage regular physical activity: Play, sports, outdoor time, and free movement help maintain strong bones and muscles and support a healthy weight.
- Prioritize sleep: Growth hormone and other important processes are active during sleep, making consistent bedtimes important.
- Avoid pressure around eating: Forcing a child to “clean the plate” or comparing them to siblings can backfire and create food struggles.
- Model a healthy attitude toward body size: Children learn from how adults talk about weight, appearances, and food.
Talking With Your Child’s Doctor
Parents sometimes leave checkups with more questions than answers about a child’s growth chart. Open communication can turn confusing numbers into a meaningful, understandable plan.
Instead of focusing on whether a percentile is “good” or “bad,” ask what the pattern over time suggests and what steps, if any, are recommended.
Helpful Questions to Ask
- “How has my child’s growth changed compared with previous visits?”
- “Is this percentile consistent with their past pattern and our family heights?”
- “What might cause the change you’re seeing on the chart?”
- “Do we need any follow-up tests, or should we first adjust nutrition and activity?”
- “What should I watch for at home between now and the next visit?”
Emotional Side of Growth Charts
Seeing a dot on a chart below or above where you expected can stir strong feelings — worry, guilt, or even pride. Remember that charts are tools, not judgments about parenting or a child’s worth.
Labeling a child as “too small” or “too big” can affect self-esteem, particularly as they grow older and become more aware of their bodies. Speaking in neutral, supportive language helps protect their sense of self.
Protecting Your Child’s Self-Esteem
- Avoid discussing specific numbers or percentiles in front of your child unless they are old enough and you can frame the conversation positively.
- Focus praise on abilities, efforts, and character rather than appearance or size.
- If changes in growth lead to lifestyle adjustments, present them as family-wide healthy habits, not as a “fix” for the child.
Frequently Asked Questions About Growth Charts
1. Does a lower percentile mean my child is unhealthy?
Not necessarily. Many healthy children live naturally at lower percentiles, especially if parents or relatives are smaller. What matters most is whether the child grows steadily along their own curve and meets developmental milestones, not whether they match an average size.
2. My child dropped from the 60th to the 30th percentile. Should I panic?
A shift like this deserves attention, but not immediate panic. Illness, changes in appetite, growth timing, or measurement differences can all cause movement between percentiles. Your doctor will usually confirm measurements, review your child’s history and habits, and decide whether to observe or investigate further.
3. Can a child “catch up” or “slow down” in growth?
Yes. Some children grow slowly at first and then experience a catch-up phase, while others are early bloomers who level out later. Puberty also brings growth spurts that can temporarily change percentiles. As long as the overall pattern settles into a reasonable path, these shifts can be part of normal development.
4. Should I weigh and measure my child at home?
Occasional home measurements can be helpful for children with specific medical needs, but for most families, frequent weighing can create anxiety. Medical offices use calibrated equipment and trained staff to ensure accuracy, so it is usually best to rely on scheduled checkups unless your doctor suggests otherwise.
5. How often will my child’s growth be checked?
In early childhood, visits are relatively frequent so that growth can be monitored closely during rapid development. As children grow older and their growth rate slows, visits are spaced farther apart, though height, weight, and sometimes BMI are still checked at routine appointments.
Key Takeaways for Parents
- Your child’s growth chart is a tool for tracking patterns over time, not a scorecard of success or failure.
- Percentiles show how a child compares to a reference group, but wide ranges can all be healthy, especially when family traits and overall health are considered.
- Sudden, repeated changes in growth patterns may need attention, while mild shifts are often normal.
- Healthy routines at home — balanced nutrition, activity, and sleep — are just as important as any number on the chart.
- Open conversations with your child’s doctor can turn confusing numbers into clear, practical guidance.
By understanding what growth charts do and do not say, parents can move from fear and confusion to confidence, supporting their child’s unique path of growth with knowledge and compassion.