
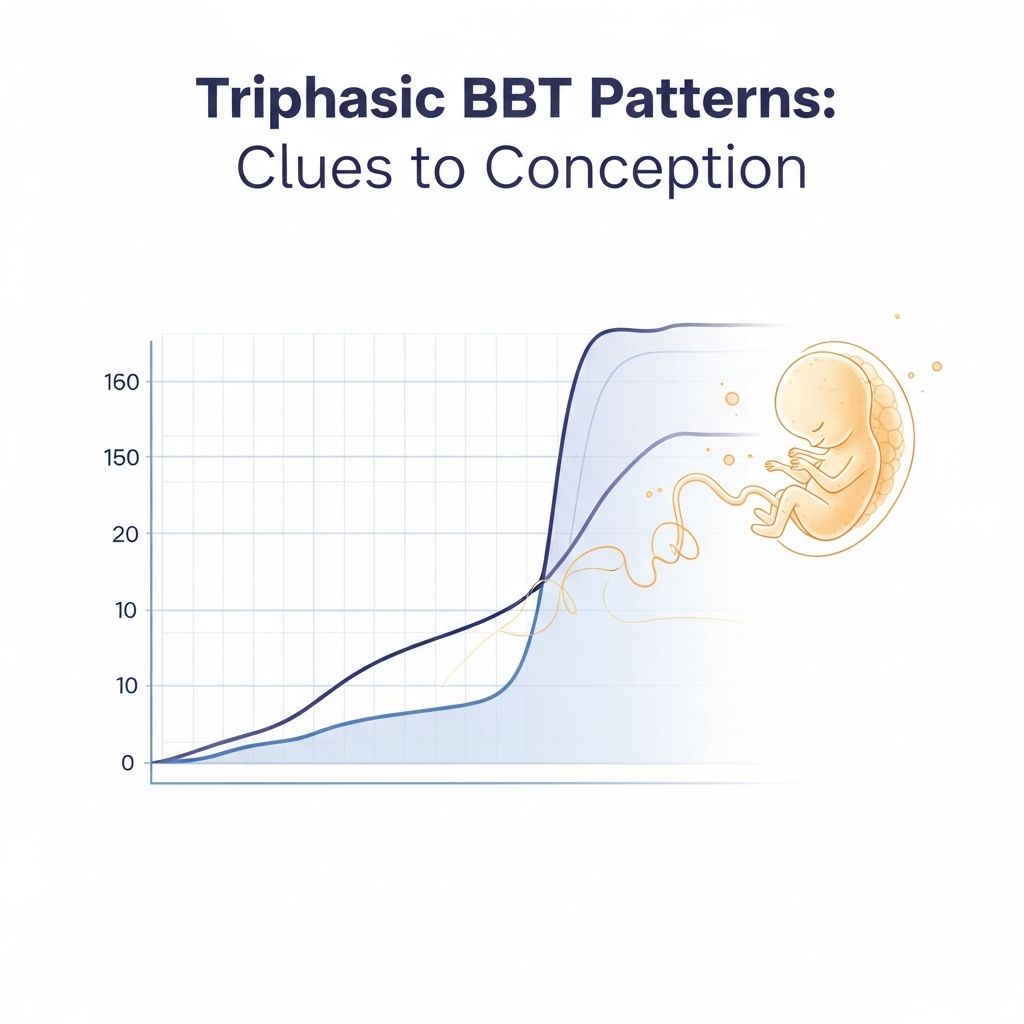
Basal body temperature (BBT) charting offers women a window into their menstrual cycles by tracking daily temperature fluctuations. A **triphasic pattern** emerges when temperatures exhibit three distinct sustained levels, potentially hinting at early pregnancy. Unlike standard biphasic charts with pre- and post-ovulation phases, triphasic charts show an additional thermal shift around 7-10 days post-ovulation, often linked to hormonal changes.
Understanding Basal Body Temperature Fundamentals
The foundation of fertility awareness lies in BBT, your lowest resting temperature taken first thing in the morning before any activity. Progesterone, produced after ovulation, elevates BBT by 0.4-1.0°F, creating a clear biphasic pattern: lower temperatures before ovulation and higher afterward.
Accurate charting requires consistency—use the same thermometer, take readings immediately upon waking, and record on graph paper or apps. Factors like illness, alcohol, poor sleep, or shifted wake times can skew results, so note these variables.
- Pre-ovulation phase: Temperatures hover around 97.0-97.7°F.
- Post-ovulation phase: Rise to 97.6-98.6°F, sustained until menstruation.
- Key tip: Ovulation is confirmed retrospectively by the sustained rise over three days.
Defining the Triphasic Temperature Profile
A triphasic BBT chart displays three plateaus: the initial low phase, post-ovulatory rise, and a third upward shift. This third level typically begins 7-10 days after ovulation (DPO), aligning with implantation timing when a fertilized egg embeds in the uterine lining.
Visualize it as a stepwise climb: first shift at ovulation (around cycle day 14), second around 9 DPO. The rise may be gradual or sudden, sometimes preceded by a brief dip. Fertility software like Fertility Friend automates detection of this pattern.
| Pattern Type | Phases | Typical Timing of Shifts | Associated Hormones |
|---|---|---|---|
| Biphasic | Two levels | Ovulation (~day 14) | Progesterone post-ovulation |
| Triphasic | Three levels | Ovulation + 7-10 DPO | Increased progesterone from implantation |
Not all triphasic charts are identical; some show a slow ascent, others a sharp spike after a dip.
Hormonal Drivers Behind the Third Shift
Progesterone is the star player. After ovulation, the corpus luteum secretes it to thicken the endometrium. Implantation boosts human chorionic gonadotropin (hCG), rescuing the corpus luteum and sustaining higher progesterone levels, which further elevates BBT.
Studies confirm higher progesterone in conception cycles, explaining the thermal surge. Wilcox et al. (1999) pinpoint implantation around 9 DPO, matching peak triphasic occurrences. Non-pregnancy causes include Clomid use (elevating early temps), minor illnesses, or environmental factors like room temperature variations.
Statistical Insights: Triphasic and Pregnancy Odds
Large-scale analysis from Fertility Friend examined 149,781 charts with fertile-window intercourse. Triphasic patterns appeared 179% more often in pregnancy charts than non-pregnancy ones.
| Chart Outcome | Triphasic Frequency | Peak DPO |
|---|---|---|
| Pregnancy | Higher (specific % not detailed) | 9 DPO |
| Non-Pregnancy | Lower baseline | Variable |
Despite the correlation, most pregnancy charts lack this pattern, and it occurs in non-pregnant cycles. It’s a promising sign boosting probability but not diagnostic—confirm with tests after 10-14 DPO.
Practical Guide to Spotting Triphasic Shifts
To identify:
- Confirm ovulation via initial rise.
- Monitor for sustained third-level temps ≥7 DPO (avg. 0.2-0.5°F higher).
- Watch for patterns: steady climb, post-dip surge, or plateau break.
Apps flag these automatically. Combine with cervical mucus, OPKs, or ultrasound for confirmation. Avoid overinterpreting early—luteal progesterone peaks can mimic it.
Common Pitfalls in BBT Interpretation
Triphasic enthusiasm can lead to false hope. Variables like stress, travel, or medications disrupt patterns. Fairhaven Health notes too many influencers make it unreliable for implantation spotting.
- Illness or fever: Spikes unrelated to hormones.
- Medications: Clomid creates artificial triphasic looks.
- Inconsistent charting: Missing days or late readings invalidate shifts.
Always cross-verify; BBT excels for cycle mapping, not pregnancy proof.
Enhancing Fertility Tracking with BBT
Beyond triphasic hopes, BBT pinpoints fertile windows: temps drop pre-ovulation, rise after. Track luteal phase length (ideally 12-14 days) for viability. Short phases may signal progesterone issues—consult a doctor.
Pair with symptoms: mittelschmerz, cervical changes. For TTC, time intercourse 1-2 days pre-ovulation.
Triphasic in Context: Other Early Indicators
BBT complements:
- OPKs detecting LH surge.
- Cervical mucus: fertile egg-white stretchy type.
- Implantation bleeding/spotting ~9 DPO.
- Early hCG tests post-10 DPO.
No single sign trumps blood/pregnancy tests.
Frequently Asked Questions About Triphasic Charts
Does a triphasic pattern guarantee pregnancy?
No, it increases odds but occurs in non-pregnant cycles too. Test after missed period.
When does the third shift typically appear?
Around 7-10 DPO, peaking at 9 DPO, aligning with implantation.
Can medications cause triphasic charts?
Yes, Clomid often mimics it by raising early temps.
Is BBT charting reliable for ovulation prediction?
Retrospectively yes; prospectively, combine with other methods.
What if my chart never shows triphasic?
Most pregnancies don’t; sustained high temps past 16 days is stronger evidence.
Empowering Your Fertility Journey
Triphasic patterns intrigue as subtle conception whispers, backed by data showing elevated pregnancy likelihood. Yet, they’re probabilistic, not predictive. Master BBT for cycle insights, but lean on tests for certainty. Consult fertility specialists for irregularities. Knowledge arms you—chart diligently, stay patient, seek joy in the process. (Word count: 1678)
References
- What is a Triphasic Chart? — JustMommies.com. Accessed 2026. https://www.justmommies.com/getting-pregnant/fertility-charting-ovulation-and-prediction/what-triphasic-chart
- Triphasic Pattern and Pregnancy — FertilityFriend.com. Accessed 2026. https://www.fertilityfriend.com/Faqs/Triphasic-Pattern-and-Pregnancy.html
- Triphasic chart — FertilityFriend.com. Accessed 2026. https://www.fertilityfriend.com/Faqs/Triphasic-chart.html
- Reading Your BBT Chart — Fairhaven Health. Accessed 2026. https://www.fairhavenhealth.com/blogs/fairhaven-health-library/reading-your-bbt-chart
- Explaining BBT Charts — Essex Fertility. Accessed 2026. https://www.essexfertility.co.uk/explaining-bbt-charts
- Triphasic BBT Chart: Your Roadmap to Understanding Ovulation — Ferty9. Accessed 2026. https://www.ferty9.com/blog/triphasic-bbt-chart-causes-triphasic-temperature-shifts