
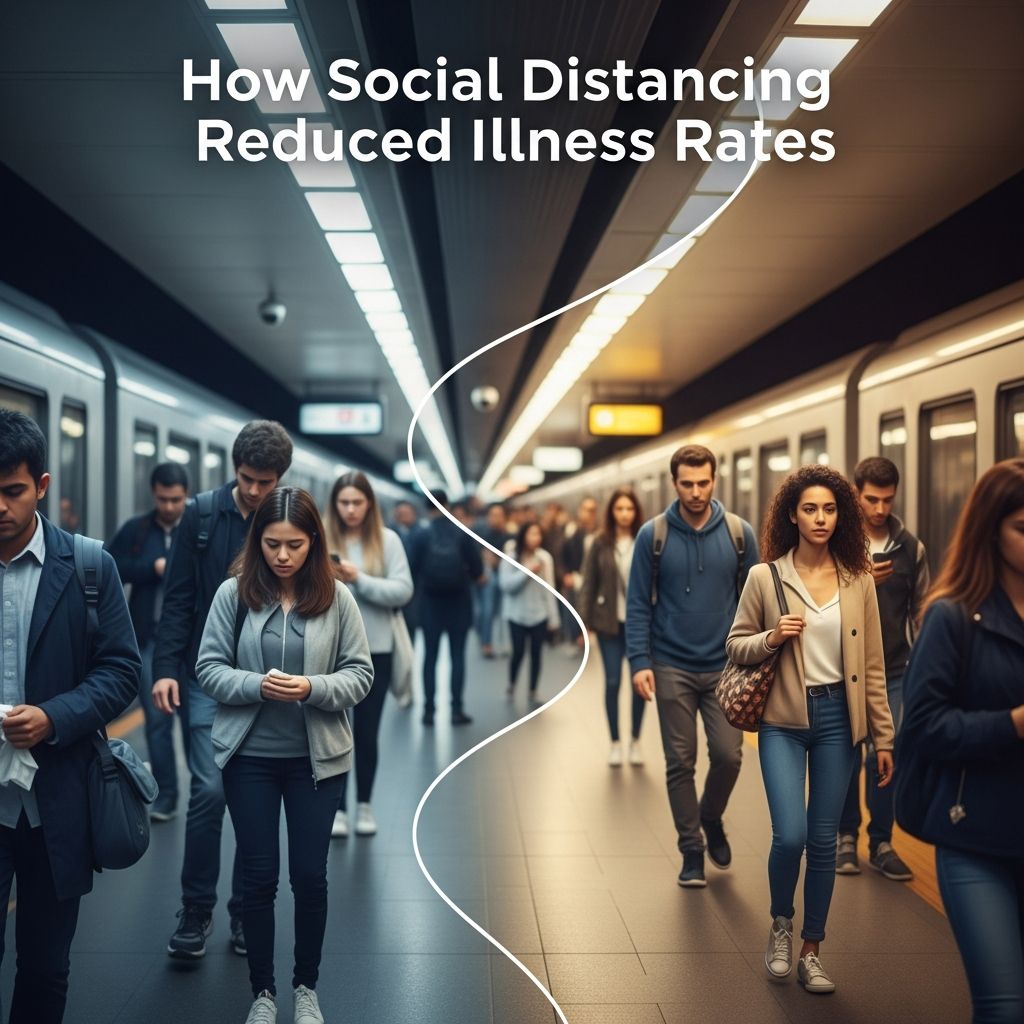
The Measurable Impact of Isolation on Population Health
When governments implemented lockdowns and social distancing protocols in early 2020, the primary focus was controlling the spread of COVID-19. However, health data revealed an unexpected but significant secondary benefit: a dramatic decline in fever cases and other common infectious illnesses across the population. Real-time monitoring systems and epidemiological studies provided compelling evidence that behavioral modifications designed to combat one pandemic inadvertently created conditions that suppressed numerous other diseases simultaneously.
The evidence came from multiple sources, including crowdsourced health data and comprehensive medical records analysis. These findings demonstrated that the interconnectedness of disease transmission meant that interrupting one pathway of infection had cascading effects across entire categories of illness. Understanding these patterns provides valuable insights into public health intervention and disease control mechanisms that extend far beyond the specific context of the 2020 crisis.
Remote Temperature Monitoring Reveals Fever Trends
A significant portion of the data documenting fever decline came from digital health technology companies that had built large networks of connected devices. One major player in this space operated a system where millions of users voluntarily uploaded temperature readings from their smart thermometers to a centralized database. This created an unprecedented real-time surveillance system that could track disease patterns across entire regions and the nation as a whole.
The technology company’s business model relied on aggregating anonymized health data to identify emerging illness patterns before they became widespread public health crises. By analyzing deviations from normal seasonal temperature patterns, the system could distinguish between typical seasonal illnesses and potentially novel disease outbreaks. When applied to tracking COVID-19 specifically, the system could identify atypical fever signatures associated with coronavirus infection.
The data generated by this monitoring system created what researchers called a “Health Weather Map” for the United States. Just as meteorologists track storm systems across a geographic region, these health monitors could visualize fever hot spots and cold zones across different parts of the country. This granular geographic data proved invaluable for understanding how interventions in specific areas correlated with changes in disease prevalence.
Documented Decline in Fever Cases Nationwide
By late March 2020, approximately three weeks after major lockdown orders took effect, fever trends showed striking improvements across most of the country. Data indicated that three-quarters of the United States had experienced measurable reductions in reported fever cases compared to peak levels recorded in mid-March. This timeline closely tracked the implementation of social distancing measures, suggesting a causal relationship between behavioral changes and health outcomes.
In one of the hardest-hit metropolitan areas, New York City, the correlation between declining fevers and improved hospitalization rates became particularly evident. As fever cases trended downward in NYC according to the temperature monitoring data, hospitalization rates for COVID-19 patients showed a corresponding improvement. Specifically, the doubling time for COVID-19 hospitalizations increased from two days to four days, meaning the healthcare system was receiving new patients at half the previous rate.
These improvements occurred in areas that had implemented lockdown measures earliest and most comprehensively. Cities and regions that shut down schools, restaurants, bars, and nonessential businesses sooner showed faster declines in fever cases compared to areas that delayed such measures. This geographic pattern strongly suggested that the specific policy interventions were driving the observable health improvements.
Broader Impact on Childhood Infectious Diseases
While the fever monitoring data provided real-time tracking, a complementary research study examined the longer-term impact on diagnosed infectious diseases in children. Researchers analyzed medical records from a large pediatric care network spanning 80 clinics across Massachusetts, tracking disease diagnoses for approximately 375,000 children aged zero to seventeen years. By comparing disease rates before and after social distancing implementation, researchers could quantify the impact across multiple illness categories.
The study examined twelve common childhood diseases that typically brought children to medical offices for treatment. These included respiratory infections like influenza, croup, and bronchiolitis; ear infections; throat infections; gastrointestinal illnesses; skin infections; and urinary tract infections. By tracking diagnoses across these diverse conditions, researchers could assess whether the benefits of social distancing extended uniformly across disease types or affected certain illnesses more than others.
The results demonstrated dramatic reductions across virtually every category examined. The most striking declines appeared in respiratory illnesses, which spread primarily through airborne droplets and direct contact. Influenza diagnoses dropped by 99.5 percent, representing an almost complete elimination of seasonal flu cases. Croup cases fell by 96.5 percent, and bronchiolitis cases declined by 92.9 percent. These massive reductions dwarfed the impact on non-respiratory infections, indicating that the physical separation of people had targeted impact on diseases transmitted through respiratory pathways.
Even infections not primarily transmitted through respiratory routes showed substantial declines, though somewhat smaller than respiratory illnesses. Skin and soft tissue infections decreased by 35 percent, and urinary tract infections also dropped by 35 percent. These more modest reductions suggested that factors beyond direct person-to-person contact contributed to lower infection rates, possibly including increased personal hygiene practices and reduced exposure in crowded settings.
The Mechanism Behind Disease Suppression
Multiple infection control behaviors operated simultaneously during social distancing periods, each contributing to reduced disease transmission. The primary mechanism involved physical separation: when people stayed home and avoided gatherings, they encountered fewer other individuals who might carry infectious pathogens. This eliminated the most common pathway for respiratory disease transmission, which requires proximity between infected and susceptible persons.
Secondary mechanisms included heightened personal hygiene practices. Increased handwashing, surface disinfection, and environmental cleaning disrupted transmission routes for pathogens that survived on surfaces or hands. These behaviors became habitual during lockdown periods and likely persisted even among individuals who were less strictly isolating. Mask wearing, initially promoted primarily for COVID-19 prevention, also provided incidental protection against other respiratory pathogens.
Reduced school attendance proved particularly significant for childhood disease suppression. Schools serve as amplification sites for infectious diseases due to the high density of children in close proximity for extended periods. When schools closed, this major transmission setting disappeared entirely. Children sheltering at home encountered dramatically fewer peers and therefore fewer opportunities for disease exposure.
The compounding effects of these multiple behavioral changes created conditions unusually hostile to infectious disease spread. Rather than relying on any single intervention, the combination of measures created overlapping barriers to transmission. This redundancy meant that even if one intervention proved incomplete, others would compensate.
Seasonal Illness Patterns Below Historical Norms
Beyond the dramatic decline in diagnosed cases, remote monitoring data revealed another striking pattern: the baseline level of influenza-like illnesses fell below the historically expected levels for that time of year. Normally, early spring represents a period of elevated respiratory illness activity in the United States. The combination of lingering winter transmission, spring allergens triggering respiratory symptoms, and changing weather patterns creates conditions where respiratory diseases remain common.
During 2020, however, this expected seasonal increase never materialized. Instead, the national trend for influenza-like illness remained depressed, even compared to off-season periods. This indicated that social distancing had not merely slowed the normal seasonal disease cycle but had actually disrupted it fundamentally. Americans experienced fewer respiratory illnesses than would typically be expected for that period in any normal year.
This phenomenon revealed how thoroughly social distancing eliminated conditions necessary for respiratory pathogen transmission. It was insufficient merely to reduce transmission; the measures actually prevented the disease from circulating at rates that would normally be considered baseline for the season.
Considerations and Tradeoffs
While the health benefits of reduced infectious disease transmission were substantial and well-documented, researchers acknowledged important counterbalancing considerations. The closure of schools and nonessential businesses created significant social and developmental costs, particularly for children. Extended home sheltering affected educational achievement, social development, mental health, and physical activity levels. These consequences were not captured in the infectious disease statistics.
Some research limitations also warranted consideration. Changes in healthcare-seeking behavior during lockdown periods meant that some disease reductions reflected decreased diagnosis rather than decreased actual illness. However, the relatively smaller impact on non-infectious conditions like urinary tract infections suggested that changed care-seeking behavior explained only a modest portion of the observed declines. The vast majority of the reduction represented genuine suppression of disease transmission.
Additionally, as social distancing measures relaxed, immunity gaps emerged in the population. Years of reduced exposure to circulating viruses meant that many individuals, particularly children, had not developed natural immunity to routine pathogens. When population mixing resumed, some communities experienced surges in illnesses that had been largely absent during isolation periods, though these represented a return to normal patterns rather than novel disease emergence.
Implications for Public Health Understanding
The data from both real-time fever monitoring and retrospective disease analysis demonstrated the remarkable effectiveness of physical distancing interventions in preventing infectious disease transmission. The magnitude of the reductions—99 percent for some diseases—exceeded many public health experts’ expectations. These findings validated core epidemiological principles about disease transmission: interrupt the contact between infected and susceptible individuals, and disease spread stops.
The experience also illustrated how interconnected disease transmission patterns are within human populations. A public health intervention targeting one specific pathogen created benefits across dozens of unrelated diseases. This suggested that investment in infection control infrastructure and practices could provide benefits extending far beyond the specific crisis motivating implementation.
For future pandemic preparedness, the evidence demonstrated that behavioral interventions could be rapidly implemented and would produce measurable health improvements within weeks. The timeline between implementation of lockdown measures and visible improvement in fever trends was remarkably compressed, suggesting that population-level health interventions achieve results more quickly than many anticipated.
FAQ Section
How much did social distancing reduce childhood infections?
Research showed reductions ranging from 35 percent for non-respiratory infections to over 99 percent for influenza cases in children, with most respiratory illnesses declining by over 90 percent.
Why were respiratory diseases more affected than other infections?
Respiratory pathogens spread primarily through airborne droplets and require close proximity between people. Physical distancing directly interrupts this transmission route more effectively than it prevents other infection types.
Did the reduction in disease diagnoses reflect actual fewer illnesses or fewer doctor visits?
While some reduction reflected fewer medical visits, the relatively modest decline in non-infectious conditions suggested that most of the reduction represented genuine decreased illness transmission rather than changed healthcare-seeking behavior.
How quickly did fever rates decline after lockdown measures began?
Real-time temperature data showed measurable improvements within approximately two to three weeks of lockdown implementation, with three-quarters of the country showing lower fever rates compared to peak levels.
What long-term effects resulted from years of reduced disease exposure?
Prolonged isolation created immunity gaps, meaning many people lacked natural immunity to routine pathogens. When social mixing resumed, some communities experienced illness surges as populations encountered viruses they had avoided during lockdown periods.
References
- Possible Good News: Fewer Fevers Reported Nationwide — Reason Magazine. 2020-03-31. https://reason.com/2020/03/31/possible-good-news-fewer-fevers-reported-nationwide-reports-smart-thermometer-company/
- Social Distancing for COVID-19 Decreased Infectious Diseases in Children — Journal of Pediatric Nursing, National Center for Biotechnology Information. 2021-02-20. https://pmc.ncbi.nlm.nih.gov/articles/PMC8815104/
- Data shows social distancing has slowed down the coronavirus outbreak — Providence Health & Services. 2020. https://blog.providence.org/national-news/data-shows-social-distancing-has-slowed-down-the-coronavirus-outbreak
- CDC Museum COVID-19 Timeline — Centers for Disease Control and Prevention. 2024. https://www.cdc.gov/museum/timeline/covid19.html
- COVID-19 Condition Information — Johns Hopkins Medicine. 2024. https://www.hopkinsmedicine.org/health/conditions-and-diseases/coronavirus