Tracking your **basal body temperature (BBT)** offers a window into your menstrual cycle’s hormonal rhythms, helping women identify ovulation and optimize conception chances. This natural method reveals a biphasic pattern where temperatures rise post-ovulation due to progesterone surges, providing valuable data for family planning.
Understanding the Science Behind BBT
The human body maintains a baseline temperature during rest, known as BBT, which fluctuates subtly with hormonal changes throughout the cycle. In the follicular phase, estrogen dominance keeps BBT low, typically between 97.0°F and 97.5°F. Post-ovulation, progesterone elevates it by 0.4°F to 1.0°F, sustaining this shift until the next period if pregnancy doesn’t occur.
This thermal shift stems from the corpus luteum’s progesterone production after ovulation. Consistent tracking over multiple cycles unveils personal patterns, aiding in predicting fertile windows retrospectively. Factors like thyroid function influence averages: low BBT may signal hypothyroidism, while high readings suggest hyperthyroidism, though medical diagnosis is essential.
Essential Tools and Accurate Measurement Techniques
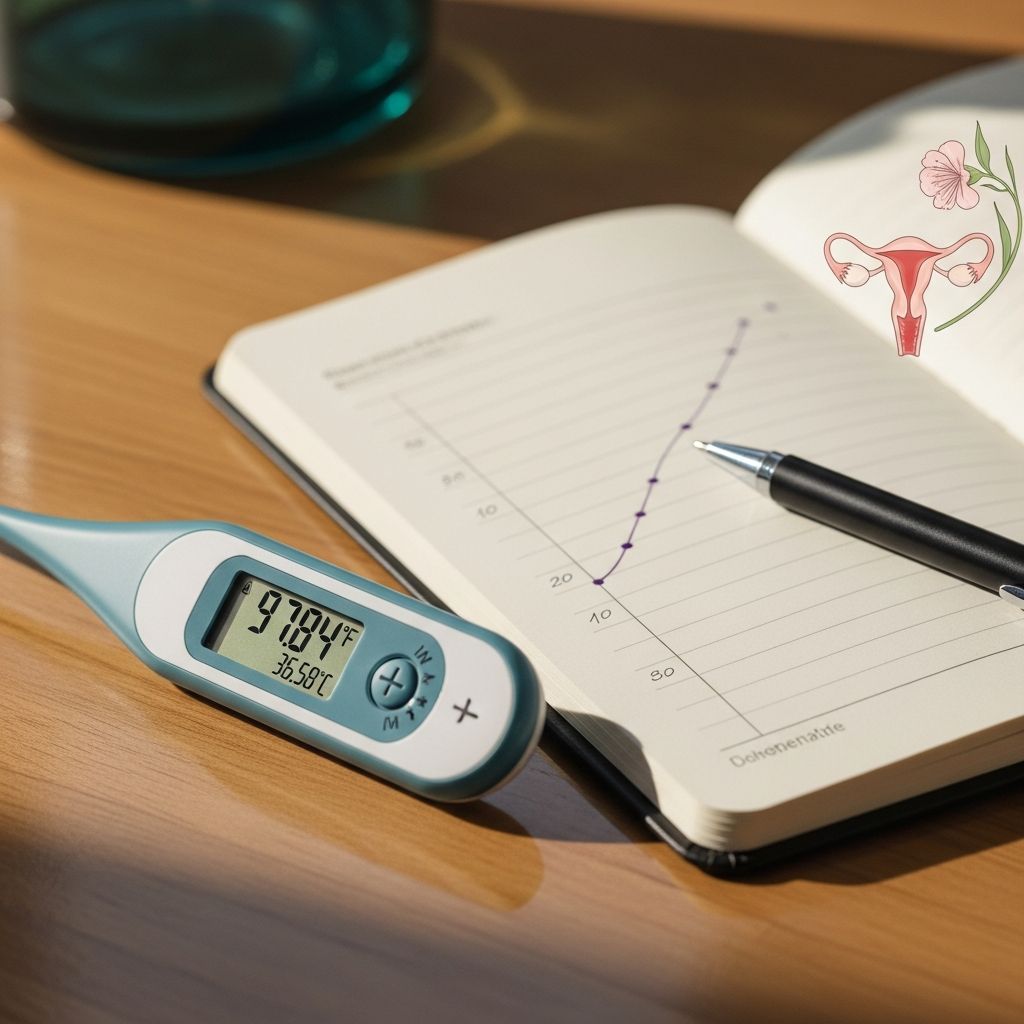
Precision is paramount for reliable BBT data. Use a digital basal thermometer sensitive to 0.01°F increments, taken orally upon waking before any activity. Consistency in timing—ideally after 3-4 hours of uninterrupted sleep—and method (oral preferred over axillary) ensures accuracy.
- Avoid measuring after alcohol consumption, illness, or poor sleep, as these cause spikes.
- Record immediately in a dedicated app or chart, noting external factors.
- Maintain a stable environment: same time daily, minimal movement.
Axillary measurements, common in some regions, yield slightly lower readings but work if standardized. Modern fertility devices automate this, syncing data for pattern analysis.
Decoding Your BBT Chart: Key Patterns
A standard BBT chart displays two phases: lower pre-ovulation and higher post-ovulation. Ovulation confirms via a sustained 0.5°F rise lasting three days.
| Phase | Typical Temperature Range | Hormone Influence | Duration Insight |
|---|---|---|---|
| Follicular (Pre-Ovulation) | 97.0-97.7°F | Estrogen dominant | Varies, often 10-16 days |
| Luteal (Post-Ovulation) | 97.6-98.6°F | Progesterone dominant | 12-14 days ideally |
Unstable patterns, like saw-tooth fluctuations in the follicular phase, may indicate stress or qi imbalances in traditional views, warranting lifestyle review. A slow rise over days post-ovulation suggests delayed progesterone buildup.
Spotting Ovulation Through Thermal Shifts
BBT excels at confirming ovulation after it occurs, not predicting it. The hallmark is a sharp 0.4-1.0°F spike within 1-2 days of ovulation, remaining elevated. Combine with cervical mucus or ovulation kits for prospective tracking.
Short luteal phases under 10-12 days signal potential progesterone insufficiency, impacting implantation. Charting multiple cycles refines accuracy, revealing anomalies like absent rises (anovulation).
Implantation Dip: A Subtle Clue?
Some women observe a brief BBT drop 6-12 days post-ovulation, termed the **implantation dip**, coinciding with embryo attachment. This 0.2-0.5°F decline lasts 1-2 days before rebounding higher, possibly linked to hormonal fluctuations during early pregnancy.
Not universal, this dip appears in about 25-30% of conception charts but isn’t diagnostic. Sustained high temperatures beyond typical luteal length, without menstruation, strengthen pregnancy likelihood. Track alongside symptoms, but confirm with tests.
Advanced Interpretations and Health Indicators
Beyond fertility, BBT reveals systemic health. Persistently low averages (<97°F) correlate with hypothyroidism, featuring irregular cycles or heavy bleeding. Elevated baselines hint at hyperthyroidism, with long cycles and anxiety.
- Saw-tooth follicular pattern: Potential stress, infections, or energetic imbalances.
- Gradual luteal rise: Progesterone delay, possibly thyroid-related.
- Short elevated phase: Luteal defect, risking miscarriage.
Traditional Chinese Medicine interprets low BBT as yang deficiency, high as heat excess, guiding holistic interventions. Always consult physicians for thyroid screening via bloodwork.
Practical Tips for Consistent Tracking Success
Build a routine: thermometer bedside, log instantly. Apps visualize trends, flagging anomalies.
- Wake at consistent time.
- Minimize pre-measurement activity.
- Note cycle day, symptoms, intercourse.
- Review monthly for patterns.
- Share charts with providers.
Illness or travel disrupts readings—mark these. After 3-6 months, patterns clarify fertile windows.
Integrating BBT with Other Fertility Methods
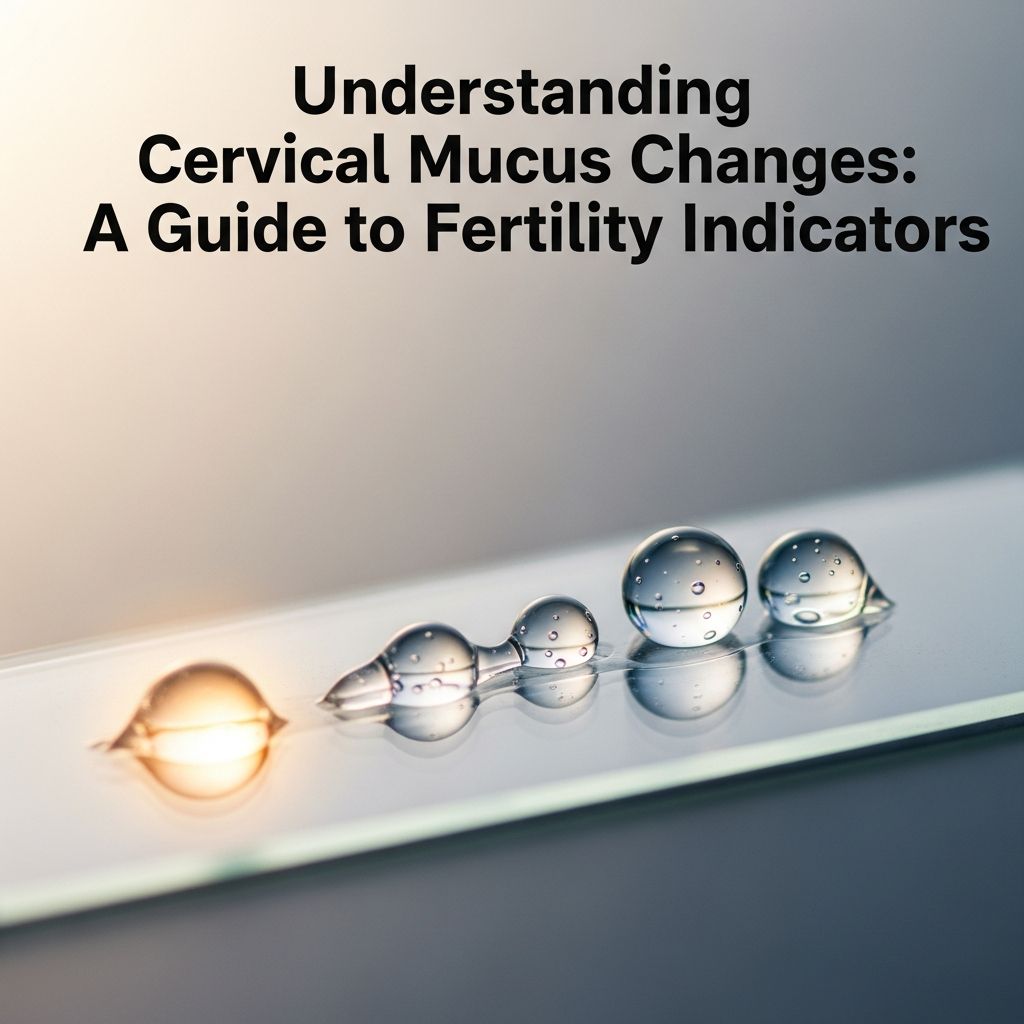
BBT complements sympto-thermal methods: mucus observation peaks fertility pre-ovulation, while BBT confirms post. Ovulation predictor kits detect LH surges prospectively. For contraception, avoid intercourse during low-cervix/mucus phases plus BBT rise.
Table of Combined Methods:
| Method | Timing | Strength |
|---|---|---|
| BBT | Post-ovulation confirmation | Cost-effective, hormone insight |
| Cervical Mucus | Pre-ovulation peak | Real-time fertile signs |
| OPKs | LH surge detection | Precise ovulation prediction |
Common Challenges and Solutions
Shifted sleep or alcohol skews data—discard erratic days. Breastfeeding suppresses ovulation, flattening charts. Perimenopause brings irregularity; persist for trends.
Solutions:
- Inconsistent wake times: Use alarm, average over days.
- Illness spikes: Annotate, exclude from ovulation call.
- No rise: Investigate anovulation causes medically.
Frequently Asked Questions (FAQs)
What basal thermometer should I buy?
Opt for digital models reading to 0.01°F, like those from fertility brands. Avoid regular thermometers lacking precision.
Can BBT predict my fertile days ahead?
No, it confirms ovulation retrospectively. Pair with mucus or kits for prediction.
Is an implantation dip reliable for pregnancy?
It’s suggestive but not conclusive; many charts lack it. Use pregnancy tests post-missed period.
How long is a healthy luteal phase on BBT?
12-14 days from rise to period. Shorter may indicate progesterone issues.
Does stress affect my BBT chart?
Yes, causing spikes or instability. Track stressors to correlate patterns.
Empowering Your Reproductive Journey
BBT tracking demystifies cycles, fostering body awareness. Whether conceiving or avoiding, it informs decisions. Consult healthcare pros for irregularities, combining with ultrasounds or labs for full pictures. Persistent anomalies merit endocrine evaluation.
References
- Basal Body Temperature (BBT) as an Indicator for Traditional Chinese Medicine (TCM) Diagnosis — Yo San University. 2023. https://yosan.edu/basal-body-temperature-bbt-indicator-traditional-chinese-medicine-tcm-diagnosis-evaluation-womens-reproductive-health/
- Basal Body Temperature Chart and Detecting Ovulation Guide — MiraCare. 2024. https://shop.miracare.com/blogs/resources/basal-body-temperature-how-does-it-estimate-my-ovulation
- Understand Basal Temperature Curves (BBT Curves) — Daysy. 2024. https://usa.daysy.me/learn-more/learn-your-cycle/understanding-bbt-curves/
- Basal Body Temperature: Definition and Charts — Clearblue. 2024. https://www.clearblue.com/how-to-get-pregnant/basal-body-temperature
- Reading Your BBT Chart — Fairhaven Health. 2023. https://www.fairhavenhealth.com/blogs/fairhaven-health-library/reading-your-bbt-chart
- Basal Body Temperature Chart — UW Medicine. 2018-11. https://my.uwmedicine.org/sites/stevie/files/2018-11/Basal-Body-Temperature-Chart.pdf