
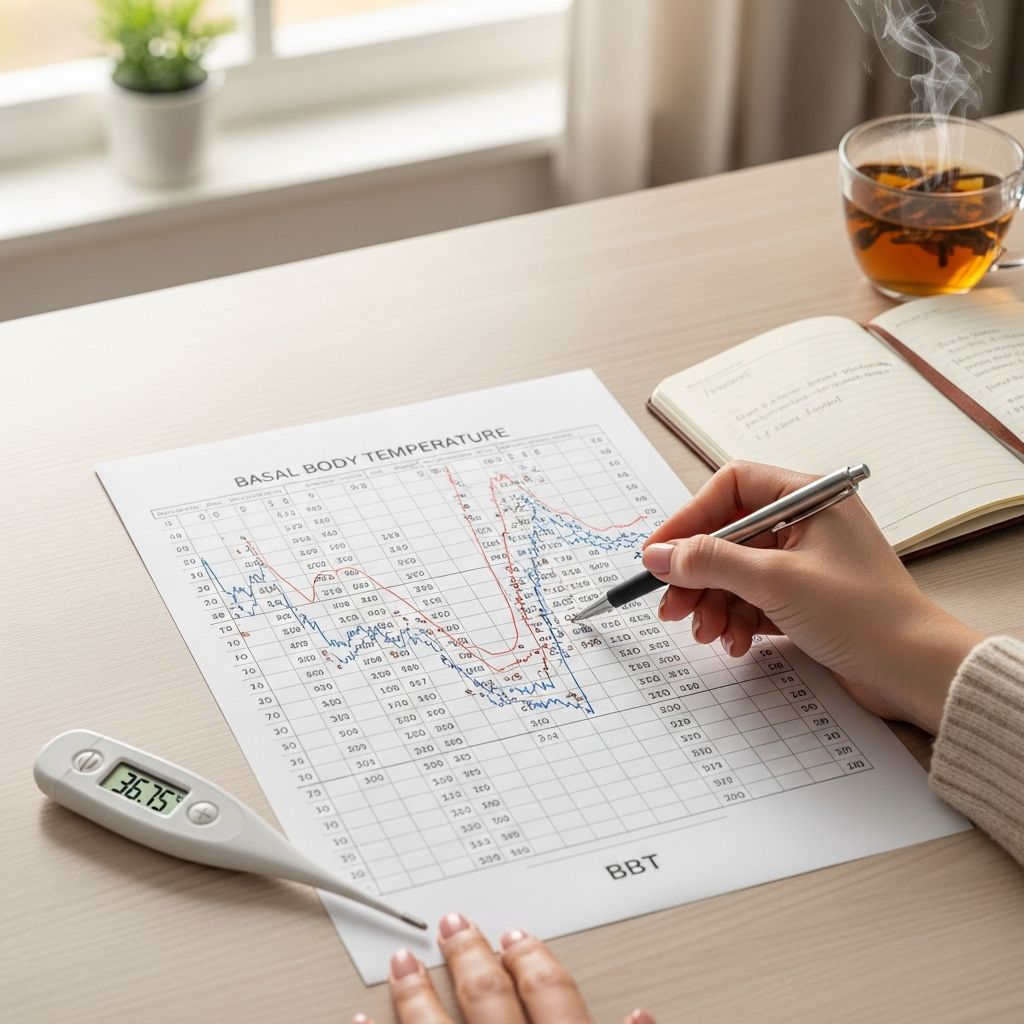
Basal body temperature (BBT) charting is a simple, low-cost way to learn when you ovulate, understand your cycle patterns, and support your efforts to conceive or practice natural family planning. By taking your temperature each morning and recording it on a chart or app, you can often see a subtle but meaningful temperature shift after ovulation.
What Is Basal Body Temperature?
Basal body temperature is your body’s lowest resting temperature, usually measured right after waking and before getting out of bed. This temperature reflects your resting metabolic state, free from the temporary increases that happen once you move around, eat, drink, or exercise.
After ovulation, progesterone levels rise and cause a slight but consistent increase in basal body temperature. This post-ovulatory rise is typically only a fraction of a degree, which is why a specialized basal thermometer with two decimal places is recommended.
How BBT Relates to Ovulation
The menstrual cycle is divided into two main phases: the follicular phase before ovulation and the luteal phase after ovulation. During the follicular phase, estrogen is the dominant hormone and basal body temperature tends to be relatively lower and more stable.
Once ovulation occurs, the ovary produces more progesterone, which has a warming effect on the body. As a result, many people see a temperature increase of roughly 0.2–0.5 degrees Celsius (or about 0.4–1.0 degrees Fahrenheit) that remains elevated until just before the next period.
Key points about BBT and ovulation
- BBT does not usually predict ovulation in advance; it confirms that ovulation likely already occurred.
- The fertile window is typically the several days leading up to ovulation, plus the day of ovulation itself.
- Recognizing a pattern over multiple cycles can help you anticipate your most fertile days.
Why Track Basal Body Temperature?
BBT charting can be a helpful tool whether you are trying to conceive, monitoring your reproductive health, or using fertility awareness for natural family planning. Over time, charts can reveal patterns that show whether ovulation is happening regularly and how long the phases of your cycle tend to be.
Many people appreciate BBT tracking because it is hormone-free, inexpensive, and can be combined with other signs, such as cervical mucus changes, to improve accuracy. It can also provide valuable information to share with a healthcare provider if there are concerns about irregular cycles or suspected ovulation problems.
Benefits of BBT charting
- Helps confirm whether ovulation occurred in a given cycle.
- Gives insight into the length and stability of your luteal phase (the time between ovulation and your period).
- Supports timing of intercourse when trying to conceive by helping you better estimate your fertile days from cycle to cycle.
- Offers a non-hormonal method to understand and work with your fertility.
Choosing a Basal Thermometer
For accurate BBT charting, a standard fever thermometer is often not precise enough. Instead, most people use a basal thermometer that shows two decimal places (for example, 97.36°F or 36.32°C). This extra precision makes it easier to detect the small shift associated with ovulation.
Thermometers may be digital oral devices, ear thermometers, or specialized wearable sensors that track temperature overnight. The most common method is a basic digital basal thermometer used under the tongue each morning.
Features to look for
- Displays two decimal places for greater precision.
- Has a memory function to recall the last reading.
- Beeps when the measurement is complete, so you know when to stop.
- Is comfortable and easy to clean.
How to Take Your Basal Body Temperature
Consistency is essential for meaningful BBT charting. The goal is to measure your temperature under similar conditions each day so that any shift you see is more likely due to hormonal changes rather than external factors.
In general, you will take your temperature first thing in the morning, before getting out of bed, speaking, eating, or drinking. Many people keep their thermometer and chart or phone on the nightstand to make this habit as easy as possible.
Step-by-step BBT measuring routine
- Place your basal thermometer beside your bed before going to sleep.
- When you wake, avoid talking, sitting up, or moving around more than necessary.
- Insert the thermometer according to its instructions (usually under the tongue) and wait until the device signals that the reading is complete.
- Record the temperature in a paper chart, spreadsheet, or fertility tracking app immediately.
- Note any unusual factors that might affect the reading, such as poor sleep, illness, alcohol consumption, or sleeping much later than usual.
Creating and Using a BBT Chart
Your BBT chart visually displays your daily readings over the course of the cycle. This can be a printed graph where you plot points, a simple table, or a chart generated in an app. The horizontal axis represents cycle days, and the vertical axis represents temperature.
Over time, you will look for a clear shift from lower pre-ovulatory temperatures to higher post-ovulatory temperatures. The day before the sustained rise is often considered the probable day of ovulation.
Example structure of a BBT chart
| Cycle Day | BBT (°F) | Notable Factors |
|---|---|---|
| 8 | 97.3 | Normal sleep |
| 9 | 97.4 | Normal sleep |
| 10 | 97.5 | Normal sleep |
| 11 | 97.6 | Ovulation suspected soon (based on prior cycles) |
| 12 | 97.9 | First higher temperature |
| 13 | 98.0 | Temperature remains elevated |
| 14 | 98.1 | Elevated; luteal phase |
In a real chart, you would continue this process for the entire cycle. A sustained pattern of higher temperatures for at least three days typically supports the idea that ovulation has occurred.
Identifying the Thermal Shift
The key feature on a BBT chart is the thermal shift, or the transition from lower temperatures to consistently higher ones. Usually, at least three higher readings in a row, compared with the previous six days, suggest that ovulation has passed.
Some people draw a horizontal coverline slightly above the highest pre-ovulatory temperature. When readings stay above this line, it reinforces the interpretation that they are in the luteal phase of the cycle.
Typical thermal shift pattern
- Pre-ovulatory phase: temperatures are relatively low and vary within a small range.
- Ovulation: one final low or slightly lower temperature may occur just before the rise, though not everyone sees this.
- Post-ovulatory phase: temperatures rise and remain higher until just before the next period or early pregnancy.
Using BBT Charting When Trying to Conceive
For conception, BBT charting is most helpful over multiple cycles. By recognizing when ovulation tends to occur (for example, around cycle day 13, 16, or later), you can plan intercourse in the few days before that expected time and on the day of ovulation if possible.
Because the egg survives only a short time after ovulation, but sperm can live several days in the reproductive tract, focusing on the days leading up to ovulation is usually more important than timing intercourse after the temperature rise.
Practical tips for timing intercourse
- Track at least two to three cycles to get a sense of your typical ovulation timing.
- Aim to have intercourse every one to two days during the fertile window (usually several days before expected ovulation and the day of ovulation).
- Combine BBT tracking with cervical mucus observation or ovulation predictor kits for a more precise fertile window.
Using BBT for Natural Family Planning
Some people use BBT as part of fertility awareness-based methods of contraception. In this context, BBT helps identify the post-ovulatory infertile phase, when the risk of pregnancy is lower if ovulation clearly occurred and enough time has passed.
This approach generally works best in combination with other fertility signs (for example, cervical mucus and cycle length patterns) and careful, consistent charting. It requires motivation, regular daily tracking, and a willingness to abstain from unprotected intercourse on potentially fertile days.
Important cautions
- BBT alone may not be sufficient as a primary contraceptive method for everyone, especially if cycles are highly irregular.
- Illness, travel, shift work, and other disruptions can make charts difficult to interpret.
- Anyone relying on fertility awareness for contraception should consider training or guidance from a knowledgeable educator or healthcare provider.
Factors That Can Affect BBT Readings
Not every temperature variation is caused by hormonal shifts. External and lifestyle factors can temporarily raise or lower your morning reading, which is why it helps to record notes alongside temperatures.
Understanding these influences can prevent misinterpretation of a single unusual reading and keep you focused on the overall pattern rather than day-to-day fluctuations.
Common influences on BBT
- Fever, infections, or general illnesses.
- Alcohol consumption the night before.
- Significant changes in sleep duration or quality.
- Waking much earlier or later than usual.
- Stress, intense exercise, or major travel across time zones.
Interpreting Unusual or Irregular Charts
Real-life BBT charts are rarely perfectly smooth. Some cycles show scattered temperatures, less obvious shifts, or multiple rises. This does not necessarily mean there is a fertility problem, but it may make interpretation more challenging.
If there is no clear thermal shift over several cycles, or if the luteal phase appears very short (for example, less than about 10 days from ovulation to the next period), it may be helpful to discuss these patterns with a healthcare provider.
Patterns to watch for
- Consistently flat charts with no noticeable rise.
- Very erratic readings that do not cluster into lower and higher phases.
- Repeatedly short luteal phases after the temperature shift.
- Unusually long cycles without clear signs of ovulation.
BBT Charting and Possible Early Pregnancy Signs
In some cases, a sustained high basal body temperature after ovulation and through the expected period date may be an early sign of pregnancy. If temperatures remain elevated for about 18 days or more after ovulation without a period, some people choose to take a pregnancy test.
However, BBT alone cannot confirm pregnancy. Only a pregnancy test and medical evaluation can provide a reliable diagnosis, and temperatures may vary even in early pregnancy.
Combining BBT with Other Fertility Signs
While BBT charting focuses on temperature, it is often more powerful when used alongside other fertility indicators. Cervical mucus changes, for example, typically show a transition from dry or sticky to more stretchy, clear, and slippery around ovulation.
Some people also monitor cervical position, use ovulation predictor kits, or track additional symptoms such as mid-cycle spotting or mild pelvic discomfort. Integrating these signs with BBT can make the overall fertility picture clearer.
Complementary fertility signs
- Cervical mucus: becomes more abundant and slippery around ovulation.
- Ovulation predictor kits: detect hormonal changes in urine that precede ovulation.
- Physical sensations: such as mild cramping or breast tenderness for some individuals.
Is BBT Charting Right for You?
BBT charting can be a helpful tool for many, but it is not perfect for every situation. People with very irregular sleep schedules, frequent night waking, or certain medical conditions may find temperature readings less predictable.
Still, even imperfect charts can provide useful information and may deepen your understanding of how your body works. If you decide to try BBT charting, giving yourself at least three cycles to practice can make patterns easier to see and interpret.
Frequently Asked Questions About BBT Charting
1. How long does it take to see a pattern on my BBT chart?
Most people need at least two or three full cycles of consistent charting before they start to recognize clear patterns. With more time, it often becomes easier to see which days tend to be most fertile and how long each phase of the cycle typically lasts.
2. Can I use a regular digital thermometer instead of a basal thermometer?
A regular thermometer may work for some, but because the temperature change after ovulation is small, a basal thermometer with two decimal places usually provides more reliable data. The extra precision can make the thermal shift easier to recognize.
3. What if I forget to take my temperature one morning?
Missing an occasional reading usually does not ruin the entire chart. Simply record a blank for that day and continue. Focus on the overall trend of lower pre-ovulatory temperatures followed by higher post-ovulatory temperatures rather than any single data point.
4. Does BBT charting work if my cycles are irregular?
BBT can still be useful with irregular cycles, because it does not rely on fixed calendar dates. However, irregular ovulation can make it harder to anticipate the fertile window in advance, so combining BBT with other fertility signs or medical evaluation may be helpful.
5. Should I talk to a doctor about my BBT charts?
If your charts repeatedly show no clear temperature shift, very short luteal phases, or patterns that concern you, it is reasonable to share them with a healthcare provider. They can help determine whether additional testing or evaluation for hormonal or ovulatory issues would be beneficial.
Final Thoughts
Basal body temperature charting is a practical way to learn about your unique cycle, confirm ovulation, and support your fertility goals. With a little patience and consistency, your chart can become a powerful tool for understanding your body and making informed decisions about conception or natural family planning.